


Talkpush responds to the customers’ constant demand for “more data”
“Can you show me how many candidates are my recruiters processing?”
“Which are the sources that are contributing the highest volume of leads?”
“How much time is it taking for the candidates to complete their interviews?”
These are just a few (of many) questions of what our customers ask every day. We all know recruitment is a numbers game. The more insights recruiters have on how their processes and funnels are performing, the easier it is for them to decide which strategy to adopt next. This data is what our customers and our internal account managers feed on.
Initially, we tried to satisfy the needs of those hungry data nerds via our embedded Analytics dashboard, but we quickly realized its limitations. One data dashboard for all doesn’t work as there so many different ways to analyze recruitment funnels. As the custom report requests keep piling up, it was clear that we had to build a scalable solution to support custom intelligence & analytic.
Over the past few months, we had been working on creating a solution that allows you to analyze your data with various levels of drill down and a new metrics we had never tracked before. This solution is now available and is being rolled out to all our existing customers.
In the video below, you will see a short demo of our standard dashboard containing various analytics & metrics for you to access at any time and at your convenience.
The key features of the reports outlined in the video are also summarized below.
Volume Overview
There are multiple sections in this dashboard that tells you the volume of applications, completed interviews, interview completion rate, interview completion method, etc. You can also toggle different views for daily view, monthly view, yearly view.
Source Analytics
Another metric that allows you to see multiple views of what volume of applications are received from each source, how the interview completions differ across sources, etc.
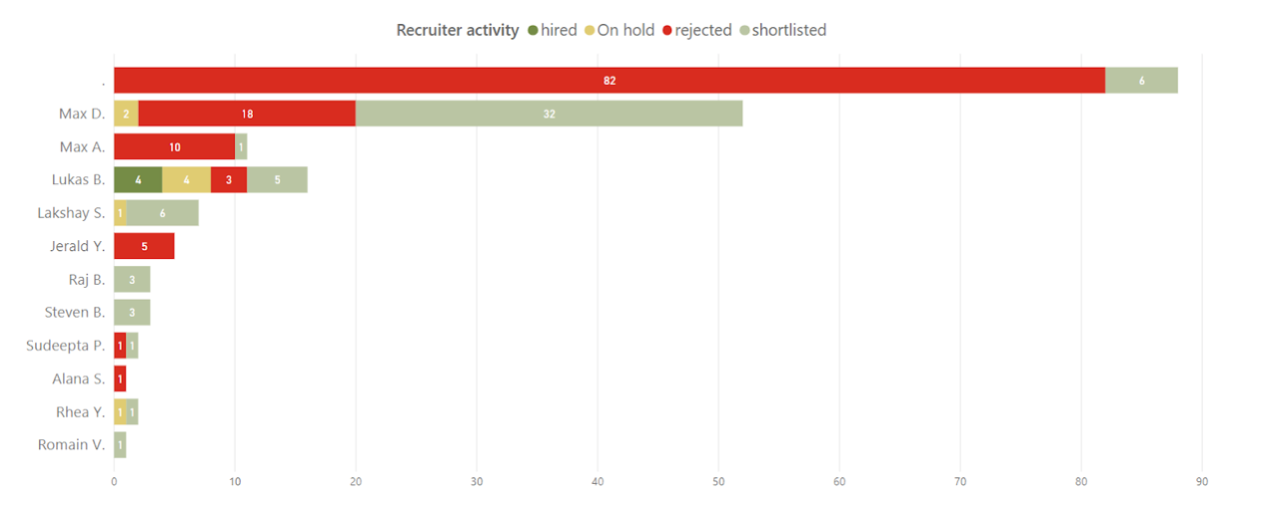
Recruiter Activity
This section covers the quantity of candidates processed by each recruiter. Think of it as a quick summary of candidates handled by your team
Recruitment Funnel: Fancy chart! Here you can see the volumes coming in from various sources and which stage of the interview process the candidates are at.
More data creates deeper insights, creates smarter operations, creates the need for yet more data… So we don’t expect this report to ever be a finished product. We are constantly adding new metrics to this dashboard, and the level of intelligence our customers will receive will continue to increase over time.
So don’t be shy about asking for more data. Our new dashboard has us willing and able to take on your data challenges faster than ever💪!